


MD-Lambda-View
Tune your carburetor like a pro, without guesswork.

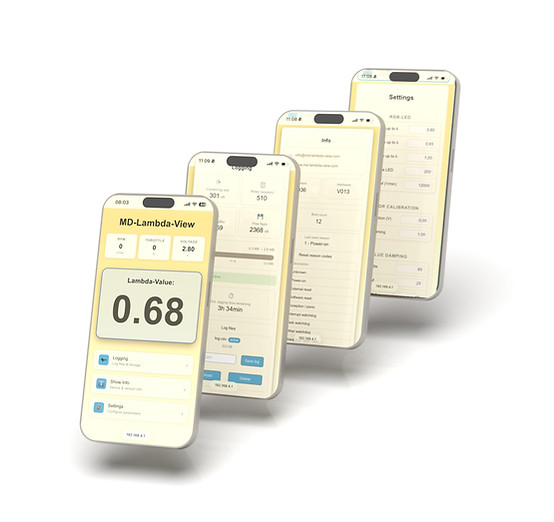
MD-Lambda-View is a data logger. It automatically saves the lambda value, throttle position, and engine speed while you drive, into a table, which you can then analyze directly on your smartphone, tablet, or PC using the analysis software .
Immediately recognize what needs to be adjusted, which main jet you need, or how the needle needs to be set.
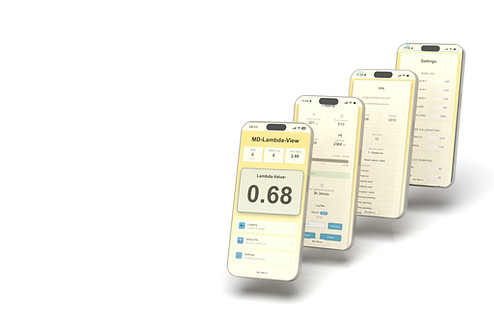
With MD-Lambda-View, you have a complete overview of all important engine parameters at all times – precise, in real time, and directly while driving. The integrated Wi-Fi web server clearly displays all measured values on Wi-Fi-enabled devices. You can easily access the data via smartphone, tablet, or laptop – no app required, directly in your browser.
With MD-Lambda-View, you have a complete overview of all important engine parameters at all times – precise, in real time, and directly while driving. The integrated Wi-Fi web server clearly displays all measured values on Wi-Fi-enabled devices. You can easily access the data via smartphone, tablet, or laptop – no app required, directly in your browser.


You know the drill: read the spark plug color, change the jet, take it for a test drive, and then guess again?
That's how we all started. But a carburetor has three systems that overlap, and without measurement data you'll just go in circles.
The free evaluation software from
MD-Lambda-View shows you in black and white in which load and speed range your mixture is too rich or too lean.
4200 rpm + 38% gas + Lambda 0.82 = too rich → Check needle position.
The result is that concrete after a single test drive.
Why MD-Lambda-View?
It is tiny and, at 65 × 36 × 18 mm, fits under any seat, hood or inside any side cover.
It's wireless and creates its own Wi-Fi network. It's operated via a web browser. No app or registration is required.
All data is fully analyzable. MD-Lambda-View is not just a display. You get a real database with a 3D lambda map instead of just snapshots.
MD-lambda-View is based on proven measurement technology. It works with the Bosch LSU 4.9 wideband probe, the standard from the automotive industry.
MD-Lambda-View is flexibly retrofittable. It includes a cable-operated sensor for classic carburetors, ignition cable adapters, and other adapters for your vehicle's specific setup.
Why MD-Lambda-View?
It is tiny and, at 65 × 36 × 18 mm, fits under any seat, hood or inside any side cover.
It's wireless and creates its own Wi-Fi network. It's operated via a web browser. No app or registration is required.
All data is fully analyzable. MD-Lambda-View is not just a display. You get a real database with a 3D lambda map instead of just snapshots.
MD-lambda-View is based on proven measurement technology. It works with the Bosch LSU 4.9 wideband probe, the standard from the automotive industry.
MD-Lambda-View is flexibly retrofittable. It includes a cable-operated sensor for classic carburetors, ignition cable adapters, and other adapters for your vehicle's specific setup.
Lucas (Porsche 356 Speedster)
The package arrived just in time for Easter, so I was able to install MD-Lamda View directly with my new carburetors.
Overall, I am very happy with the product and would recommend it anytime.


Tim from Bonn (MGB GT)
... I installed the MD LambdaView in my MGB GT last week, along with a completely overhauled engine and HIF4 twin carburetors.
This is extremely helpful for setting up the carburetors, but especially during engine break-in. As long as you keep an eye on the green (blue) LED, you know you're not running too lean – that's incredibly reassuring.
The connection is incredibly easy. Since the device is so small and light, I use Velcro to attach it behind the dashboard. So it's simple and practical.
Here's how it works (3 steps)
1. Connect
Lambda sensor in the exhaust (lambda sensor not included), RPM signal from the ignition coil, throttle position via potentiometer or cable sensor . A skilled mechanic can complete the job in an afternoon.
2. Driving
MD-Lambda-View automatically logs all three values to the internal memory at up to 25 Hz. The RGB LED displays the current lambda value while driving.
3. Evaluate
Data is transferred via Wi-Fi to your mobile phone, tablet, or PC, without an app and directly in your browser. The free analysis software creates a 3D lambda map and immediately shows you where you need to make adjustments.




Technical Data
Power supply:
9V -15V
Power consumption:
0.8A - 4A (depending on the heating current of the lambda sensor)
Connection protocol:
WIFI, password 8 characters
Entrances:
Engine speed, throttle position, lambda sensor
Outputs:
RGB LED
Operation and settings
Web server
Dimensions:
70mm x 36mm x 18mm
Lambda sensor controller based on
SLCFree by 14point7
Software unter GPL V3 license
Power supply:
9V -15V
Power consumption:
0.8A - 4A (depending on the heating current of the lambda sensor)
Connection protocol:
WIFI, password 8 characters
Entrances:
Engine speed, throttle position, lambda sensor
Outputs:
RGB LED
Operation and settings
Web server
Dimensions:
70mm x 36mm x 18mm
Lambda sensor controller based on
SLCFree by 14point7
Software unter GPL V3 license
Power supply:
9V -15V
Power consumption:
0.8A - 4A (depending on the heating current of the lambda sensor)
Connection protocol:
WIFI, password 8 characters
Entrances:
Engine speed, throttle position, lambda sensor
Outputs:
RGB LED
Operation and settings
Web server
Dimensions:
70mm x 36mm x 18mm
Lambda sensor controller based on
SLCFree by 14point7
Software unter GPL V3 license

Take back control of your carburetor!
MD-LAMBDA-VIEW DATA EVALUATION
3D Analysis
With the MD-Lambda-View data analysis software, you can visualize and analyze your saved logging data in detail. The web application creates a clear 3D surface diagram from lambda values, engine speed, and throttle position, showing you how the mixture behavior changes in different load and engine speed ranges. Various display and filter settings help you optimally adapt the visualization to your needs, ideal for EFI tuning or analyzing engine performance and lambda values.

2D Analysis
With 2D analysis, you can visualize your logging data if you only log the lambda value and the throttle valve or carburetor slide position, as is common with a carburetor.

Both data analysis tools are freely available web applications that work in any modern browser. No installation is required; simply open the application, load the CSV logging data, and immediately analyze the most important engine parameters in 3D or 2D diagrams.
MD-LAMBDA-VIEW CABLE PULL SENSOR
.png)
Reliably determining the throttle valve or carburetor slide position is a challenge on many engines. While a sensor can often be retrofitted to the throttle shaft of a modern throttle body, usually requiring considerable modifications, the situation is significantly more difficult with classic carburetors. Suitable mounting points are often completely lacking, making precise load signal measurement virtually impossible. This is exactly where the MD-Lambda-View cable pull sensor comes into play.
MD-Pico, the display for MD-Lambda-View in matchbox format
MD-Pico is a mini-display, specifically designed for MD-Lambda-View, and is about the size of a matchbox. It is extremely compact, lightweight, and perfectly suited for test drives. Despite its small size, MD-Pico offers powerful features and also functions as a mobile lambda data logger. MD-Pico has an SD card slot, through which all important engine data is permanently recorded as soon as an SD card is inserted.
